News reports and
editorials (back
to top)
- Santa Barbara
News-Press
- "Making the Grade.
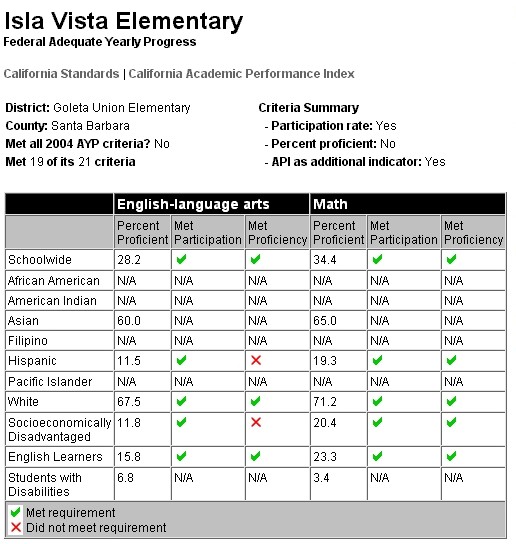
La Cumbre Junior High, McKinley and Isla Vista Elementary
on list." Oct. 10, 2004.
- Letters regarding school
transfers. March 5, 2005.
- "Federal
educators' deal raises failing schools from 14 to 184. State
to avoid financial penalties; list shorter than expected."
March 9, 2005 (compare LATimes, below)
- "S.B. Elementary
District Likely to Face Sanctions." March 9, 2005
- "McKinley
stands out in state test scores." March 16, 2005
- "Goleta schools
may leave U.S. funds behind. Frustrated by 'No Child,' board
members weigh giving up federal money to get rid of sanctions."
March 18, 2005
- "Goleta schools chief
says don't ditch federal law. Dropping No Child Left Behind
would mean loss of funding." April 20, 2005
- "Goleta
teachers [to] weigh forfeiting funds. District would lose $450,000
if it opts out of federal No Child Left Behind program." April
23, 2005
- "Transfer
students deluge La Colina. Influx at high-performing middle
school caused by option under No Child law." May 10, 2005
- "Goleta finds compromise
on 'No Child': District to shift federal funds to poorest schools,
restricting reach of sanctions," July 7, 2005
- Santa Barbara
Independent
- Goleta Valley
Voice
- LA Times
- "1,200 Schools
in State Could Face Federal Penalties. Under the No Child Left
Behind law, about 13% of public campuses may be labeled failures
as test scores fall short of goals, a Times analysis shows."
Oct. 13, 2004
- "41 Local [Ventura
County] Schools Fail Federal Goals. The campuses now face sanctions
under the No Child Left Behind Act. Some criticize the law doesn't
give credit for student improvement," Oct. 14, 2004
- "School Is Down but
Looking Up. Sun Valley campus is among 1,626 statewide that
have failed to meet federal standards. But scores don't tell the
whole story." Oct. 14, 2004
- "Sure Feels Like
Being Left Behind. Replete with the children of migrants, Coachella
Valley schools again fall short of federal goals. Officials want
time." Oct. 14, 2004.
- "Pace of School Gains
Is Slowed. Fewer than half meet their goals, a sharp decline
from last year's performance. Budget cuts, bigger classes, loss
of focus blamed. 52% of Schools in L.A. Meet Goals, Down From 85%."
Oct. 29, 2004. (see 11/11/04 editorial, below)
- "Few Parents Move Their
Children Out of Failing Schools. Federal law allows transfers,
but critics say it ignores the communal role of local campuses."
Nov. 8, 2004
- "The Easy School
Fixes are Over. editorial" Nov. 11, 2004, with response
by superintendent O'Connell..
- "Are Schools
Cheating Poor Learners? Officials say federal rules compel them
to focus on pupils more likely to raise test scores." Nov.
28, 2004.
- "U.S. May Force
California to Call More School Districts Failures." Feb.
17, 2005
- EDITORIAL "Let's
Try 'No State Left Behind'," Feb. 24, 2005
- "New Criteria
Cut Ranks of Targeted School Systems. But L.A. Unified and 183
other districts in state would stay on watch list under U.S. compromise."
March 9, 2005
- "10 Schools Run
Out of Time to Catch Up. Nine campuses in L.A. and 1 in Visalia
top the No Child Left Behind law's seven-year limit. Their fate
is uncertain." Sept. 21, 2005
- "Parents' Involvement
Not Key to Student Progress, Study Finds. Report on standardized
testing in lower-income schools disputes conventional wisdom,"
LA Times, October 26, 2005.
- Education Week
(you need to register for free to access these articles, but they have
lots of excellent links):
- "Chicago
Resisting Federal Directive on NCLB Tutoring," Jan. 5,
2005 (direct
link).
- "States
Dicker Over Changes to AYP Plans," July 14, 2004
- "Data
Show Schools Making Progress on Federal Goals," Sept. 8,
2004
 HM: Well, much of this progress was because "the U.S. Department
of Education has relaxed a number of rules on how AYP is calculated
and approved numerous amendments to the state accountability plans."
In 2004 California's proportion of "passing" schools increased
from 54% to 65% largely because only 14% of large high schools did
not have at least 95% of their students take the tests (in 2003:
35% missed the participation target).
HM: Well, much of this progress was because "the U.S. Department
of Education has relaxed a number of rules on how AYP is calculated
and approved numerous amendments to the state accountability plans."
In 2004 California's proportion of "passing" schools increased
from 54% to 65% largely because only 14% of large high schools did
not have at least 95% of their students take the tests (in 2003:
35% missed the participation target).
- "Academic
Abilities Similar, Yet AYP Outcomes Different," Sept. 8,
2004
 Performance Standards for Math. The chart
shows what students must score in their respective states
and grade levels to be deemed "proficient" on state math tests.
It also shows the percentiles in which those states' "cut"
scores fall on the Northwest Evaluation Association tests.
The percentiles reflect the proportion of a representative
national student population that took the NWEA tests and performed
at or below the score. (source: Northwest Evaluation Association,
Portland, OR; published in Education Week, 12/3/03)
Performance Standards for Math. The chart
shows what students must score in their respective states
and grade levels to be deemed "proficient" on state math tests.
It also shows the percentiles in which those states' "cut"
scores fall on the Northwest Evaluation Association tests.
The percentiles reflect the proportion of a representative
national student population that took the NWEA tests and performed
at or below the score. (source: Northwest Evaluation Association,
Portland, OR; published in Education Week, 12/3/03)
|
Compares standards set by Florida and Georgia.
- See also this Dec. 3, 2003 article: "'Proficient'
Mark Shifts by State, Grade, Subject" and an even earlier
article (Oct. 9, 2002): "States
Revise the Meaning Of 'Proficient'."
- State Progress Reports (1 page
pdf), excel version. Table
of all states showing the number and percentages of schools that
made AYP in 2003 and 2004. (more detail under the "Federal"
category on this page, above)
- "Adequate
Yearly Progress" explained (with hyperlinked sources)
- National Public
Radio
|
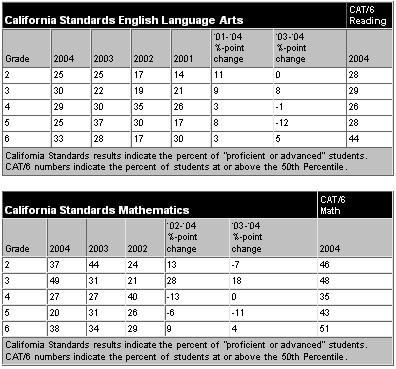 which are administered as part of the STAR testing regime each April.
Reading these tables diagonally from upper right to lower left gives
some idea of the progression of a cohort of students (2nd graders in
2002 are 3rd graders in 2003 are 4th graders in 2004). The only negative
thing that stands out to me in this data is that 5th grade math did
not do a good job, with cohorts dropping from 27% to 20% (2003 4th grade
-> 2004 5th) and 40% to 31% (2002->2003). The 03-04 cohort also
dropped in reading from 30% to 25%.
which are administered as part of the STAR testing regime each April.
Reading these tables diagonally from upper right to lower left gives
some idea of the progression of a cohort of students (2nd graders in
2002 are 3rd graders in 2003 are 4th graders in 2004). The only negative
thing that stands out to me in this data is that 5th grade math did
not do a good job, with cohorts dropping from 27% to 20% (2003 4th grade
-> 2004 5th) and 40% to 31% (2002->2003). The 03-04 cohort also
dropped in reading from 30% to 25%. 